The optics
Traditional SIM was invented by Mats Gustafsson (Ref. 1) and relies on a known periodic illumination patterned made of lines (grid) which are applied to the unknown sample, and by the interference between the grid and the sample new additional spatial information are revealed.
In our SIM, the light is structured by a mask made of a lattice of spots diffraction limited (i.e., multi-spot lattice SIM) generated by micro lenses. Through the mask, the light pattern is projected on the sample, and by shifting the mask of a precise angle with a galvo mirror, the sample is entirely scan and multiple raw images are acquired. Raw images are collected and combined by an algorithm to computationally reconstruct a super-resolved image, achieving double spatial resolution that the optical system is capable of (Fig. 2).
In summary, the structured illumination is generated by a micro-lens arrays enabling optimal light throughput, uniform light intensity and optimal out of focus light rejection. Compared to other SIM approaches based on stripes patterns, Our SIM ensures high contrast for in-depth acquisition, a great speed increases in imaging acquisition and robust elaboration, eventually ensuring an optimal optical sectioning.
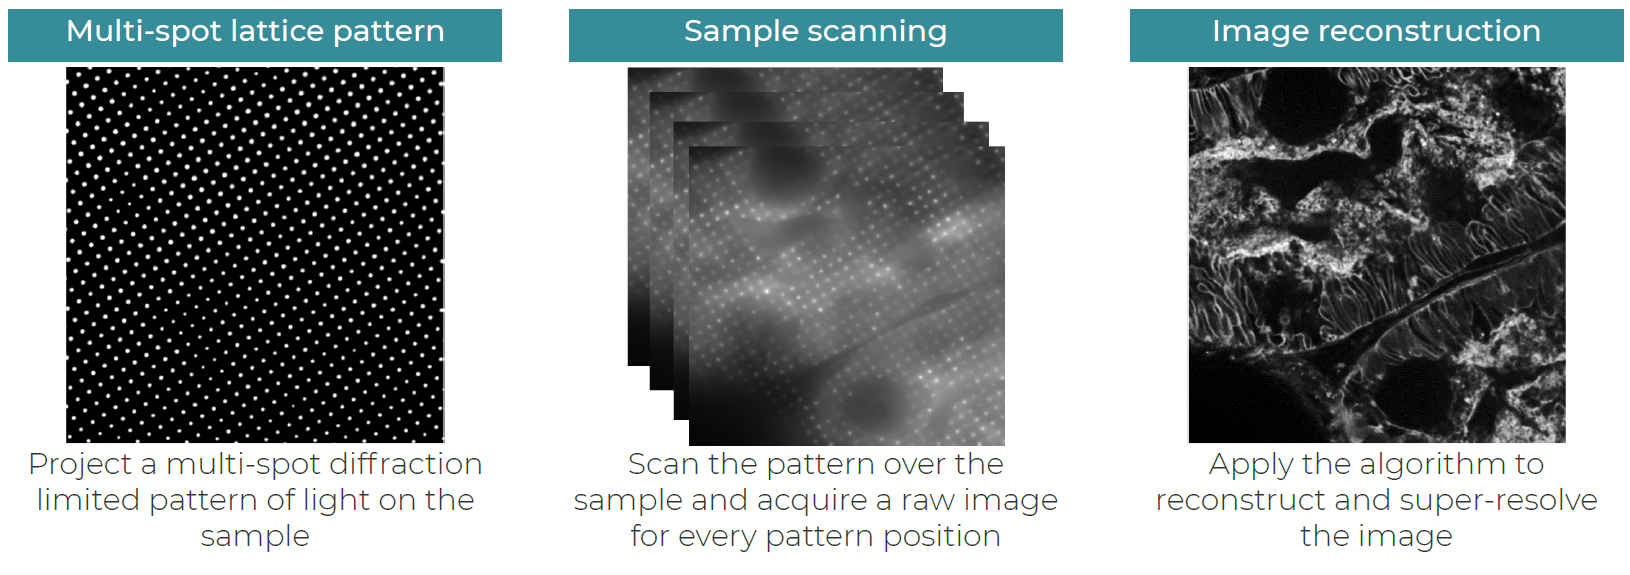
Figure 2: Overview of acquisition steps and data processing
The computation
The final step to get a super-resolved image is to apply a reconstruction algorithm on the acquired raw images. The computation is based on the point spread function (PSF) of the optical system, similarly to what deconvolution process does. Due to the small PSF and good optical sectioning, SIM leads to an overall 2x increase in lateral and axial resolution. Simplifying, the algorithm extracts in focus biological information subtracting out of focus signal contribution. Our SIM approach is a modified version of the joint Richardson-Lucy (jRL) deconvolution and applied to multi-spot SIM enables an improvement in resolution by a factor 2 respect to widefield (Refs 2;3; Fig 3).

Figure 3: Image examples of a widefield data formed by in focus and out of focus information, out of focus signal calculated by our model and in focus product outcome obtained after computation
Like the traditional Richardson-Lucy deconvolution method, image reconstruction is achieved by a Maximum Likelihood Estimation (MLE), a statistical approach, starting from raw images, leads to the output super-resolved image through an iterative method tending to mathematically minimize statistical parameters. In computational mathematics, an iterative method is a mathematical procedure that using an initial value to generate a sequence of improving approximate solutions for a class of problems, in which the n-th approximation is derived from the previous ones (Fig. 4).
In fact, the number of iterations usually required is about 25 iterations and is automatically set. Anyway, the operator can modify this value via software with an “Advanced mode” option available. To note, a highly parallelized CUDA code is used for fast elaboration.

Figure 4
We combine how the sample is illuminated and how computationally super-resolved data are obtained, allows an improvement of the image optical sectioning leading to a resolution enhancement in all 3D dimensions (XYlateral resolution: ~100 nm; Z-axial resolution: ~300 nm). Resolution measurements (i.e.full width at half maximum (FWHM) value) in XYZ directions have been done with different tools: Argolight SIM-slide, Gattaquant SIM-Nanorules, biological structures such as cellular cytoskeleton and TermoFisher Tetraspeck Beads. See Fig. 5 for technical details.
Figure 5: FWHM measurements. A) Argolight SIM-slide pattern where bars are progressively separated. The distances resolved are indicated in the figure and values are given in nanometers. B) SIM-Nanorules of 120 nm. SIM measures 126 nm in XY plane. C) Tubulin (cytoskeleton) in microglia cell: 100 nm are measured in XY plane. D) Beads of 100 nm: 102 nm resolved in XY plane, and 290 nm resolved in Z direction. All measurements have been performed at 510 nm emission wavelength with a 100X oil 1.45 NA Plan Apochormat objective.
SIM reconstruction algorithm preserves linearity. The behaviour of the in-focus information has been tested by a linear increase in the exposure time and the measured increase in signal intensity (i.e., the in-focus information obtained with the same reconstruction parameters, such as number of interactions) is linear with the exposure time used to get the raw images (e.g., doubling the exposure time, a double number of counts in the final image is observed; Fig. 6)

Figure 6: Intensity measurements along the 16 stripes (Argolight SIM-slide pattern: bars with progressive intensity). By doubling the exposure time (green line: 500 ms; orange line: 250 ms) a double number of counts (Y axis, Intensity) is obtained in the final image.